Quick Start Guide
A brief introduction to the data analysis and data import from multiple logger manufacturers.
Video run time: 19 min
Video content
- Analysis
- Data Import
Introduction
Watch this video if you are experienced in race data analysis.
Video run time: 33 min
Video content
- Help system
- Navigation (Modules, Submodules)
- Create a rider
- Data import
- Lap selection
- Configuration of plots
- Working with plot templates
- Zoom, Pan, Reset
- Comparison of multiple laps
- Time difference analysis
- Section analysis
- Ideal time
- Using snap shoots
Extended Introduction
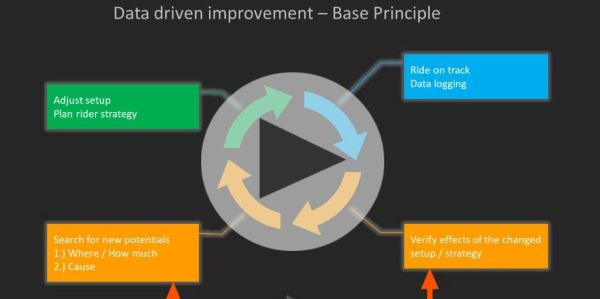
This video is created for people who have no or less experience in race data analysis. Beside showing concepts and workflows, some basic considerations regarding data-driven improvements will be presented. A real-world example will be used to explain the topics.
Video run time: 1 h 32 min
Video content
- Data-driven improvements
- Your benefits
- Help system
- Navigation (Modules, Submodules)
- Rider creation
- Data imports (in detail)
- Lap selection panel, much more than just lap selection
- Benchmark data
- Configuration of plots
- Data tips and markers
- Working with plot templates
- Zoom, Pan, Reset
- Multi lap comparison (detailed example)
- Understand X-axis "Track Position"
- Time difference analysis in detail
- Sections analysis
- Ideal time
- Working with snap shoots
")
")